Breadcrumb
- Home
- Labs
- Advanced Labs
- Stellar Photometry
- Part 1: Imaging and Brightness
Part 1: Imaging and Brightness
Exercises

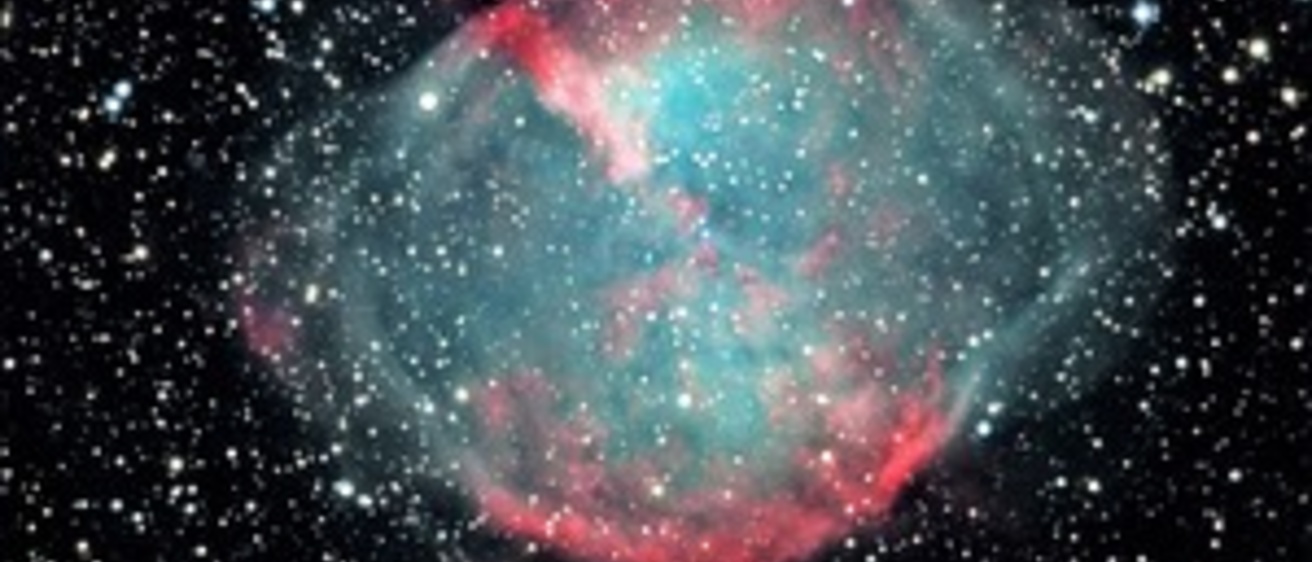
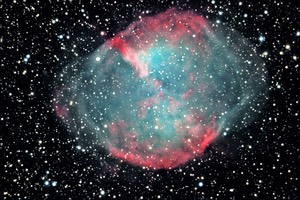
For this section you will make measurements on an image of Messier 27 (the Dumbbell Nebula).
When you move the mouse over an image in Maxim, the pixel coordinates and the intensity of that pixel are shown in the status bar at the lower right. The intensity (i:) is given in arbitrary units - a larger number corresponds to a brighter pixel.
- Look at the stars in the image and, judging roughly by eye, pick a few that look like the brightest stars. Find the maximum intensity value (the brightest pixel) in each of these stars. Explain why these stars appear the brightest to you.
- Pick out several more stars that look about half as bright as the first group, and a third group that look about half as bright as the second. Find the maximum intensity value for each of these stars as well and compare the intensity values between the different groups. Is the relationship what you expect? What explanations can you think of for the relationship between the intensity values and how bright the stars appear to your eyes?

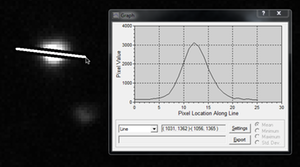
- Select one of the stars from your second group and zoom in on it so that it is easy to see the individual pixels. Open the graph tool by selecting View -> Graph Window. Select Line in the box at the lower left of the Graph Window and drag a line across the star. Do the same for several other stars. Why does the intensity profile have that particular shape?
- Measure some intensity values in the nebula (the fuzzy cloud) and get an idea of the average value. Do the same for a blank area of the sky. How could you determine the total brightness of the nebula?