Resources: N/A

Terminology: SpectrumSpectral LinesEmission Lines

Tutorials: Importing Images into RspecWavelength Calibration in Rspec, Overlaying Series in Rspec, Scheduling Observations with Rigel

Background

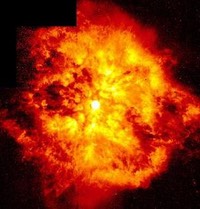
wr-hubble_med.jpg
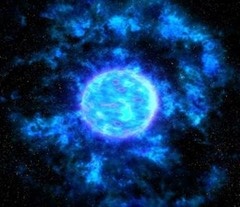
A Hubble false-color image of a Wolf-Rayet star showing the gas envelope around the star. 

Wolf-Rayet stars are an exotic class of rare, intensely luminous stars characterized by spectra with sharp emission lines. These unusual spectra were first noticed in 1867 by two astronomers at the Paris Observatory, Charles Wolf and Georges Rayet, but a full understanding of how they produce these spectra was not achieved until the mid twentieth century.

The more massive a star is, the shorter its lifespan - and Wolf-Rayet stars are among the largest and shortest lived stars known, typically over 20 solar masses with surface temperatures well over 25,000 K. Strong stellar winds eject material from their atmosphere into shells of hot gas which surround the star. Energy radiated by Wolf-Rayets, at levels many orders of magnitude greater than our Sun, peak in the ultraviolet. These ultraviolet rays ionize the gas in these shells to produce the trademark emission lines of the Wolf-Rayet stars.

Wolf-Rayet stars are rare, with less than 200 known in our galaxy. However, due to their intense brightness these stars are clearly visible, with apparent magnitudes ranging from 9 - 12. These spectra are striking in contrast to main sequence stars, featuring strong emission lines peaking above their spectra, instead of the weak absorption lines in typical stellar spectra. These emission lines provide a classification system for Wolf-Rayets.

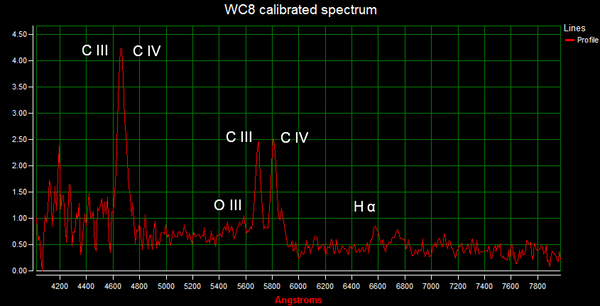
* Carbon-type Wolf Rayets (WC) have a simpler spectrum with two very large peaks at CIII and CIV with a smaller peak at Hydrogen alpha.

WC8newlabel2

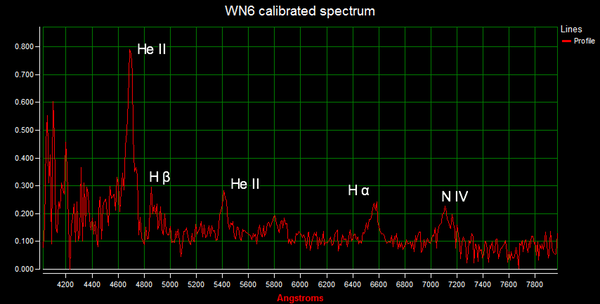
* Nitrogen-type Wolf Rayets (WN) have a more chaotic spectrum with five or more large peaks corresponding to various helium and nitrogen lines.

WN6newlabel

Guideposts

  • A challenge of this lab is the scarcity and uneven distribution of Wolf Rayet stars. There are around 150 known, but over two-thirds are in the Southern hemisphere.  You will need to set up observations for four or five Wolf-Rayet stars for analysis. For the fall term, these are some suggestions:
Star Apparent Magnitude Right Ascension (RA) Declination (DEC)
HD192103

8

20:11:53 36:11:51
HD193793

7

20:20:28 43:51:16
HD211853

9

22:18:45 56:07:34
HD213049

11

22:27:17 56:15:13
HD214419

9

22:36:53 56:54:21

Note that these coordinates are for the object themselves and NOT for the right ascension adjustment necessary for capturing centered spectra.  Make sure you offset your right ascension by -00:00:30 to properly center the object's spectrum in your image.

  • When you open each image, you will likely need to adjust the spectrograph to only view the spectrum of your object.  If you're not sure where your object is located in the image, look at the spectra of various stars.  The spectral lines will make it clear which object in the image is the Wolf-Rayet star.
  • Below is a table labeling several common elements found in Wolf Rayet spectra and their wavelengths in Angstroms.  Use this as a reference to identify the emission lines found in your spectrum.
Element Wavelength (Å) Element Wavelength (Å)
H α 6563 C IV 5801
H β 4861 C III 5696
H γ 4341 C III and IV 4650
H δ 4102 O III 4959, 5007
He II 4686, 5411 N IV 7109
  • Note that WC stars will have carbon series lines, but WN will be dominated by helium and nitrogen lines. Figure out the major lines first, as the shorter ones may be due to a star having properties of both spectral classes.
Wolf-Rayet spectra

Levels: 2

Learning Goals: Students will classify Wolf-Rayet spectra, and identify the emission lines in each spectrum. The successful completion of this lab will require an understanding of spectral features and the interpretation of spectra.

Challenge: Stars produce detailed spectra that are one of the most important sources of information about the star. Main sequence stars will have a spectrum curving along the Planck function with absorption lines for major elements like hydrogen dipping down. But some spectra look unusual: Instead of dipping absorption lines, they have towering emission lines. How might this pattern of peaks and wiggles give us a picture of the chemical make up of a star?

In this lesson you will apply your understanding obtained in lecture of the features and origin of a spectrum to examine several unusual examples. You will set up observations for at least three and preferably up to five or six stars through the University of Iowa's robotic telescope, Rigel, located in southern Arizona.

Throughout this lab you will collaborate with your group to build a consensus on identifying the major spectral lines and answering the analysis questions. For each line, you will want to describe how you decided on each identity. Students will also be asked on the worksheet to classify each Wolf Rayet star according to the two main types described in the introduction.