Exercises

  1. Examine the images. What constitutes as a sunspot? (What are your criteria?)
  2. For each image, count the number of sunspots you see. Plot the number of sunspots as a function of year on the graph on the lab manual. Make sure you are consistent with your criteria in what constitutes a sunspot (The size of a sunspot can change, how would this effect your counting?) Be sure to label your plot.
  3. What trend do you observe in your plot? What year has the least number of sunspots?
  4. How long does it take to go from solar maximum to solar minimum?
  5. From your observations, is the Sun in solar maximum or solar minimum? If neither, where in the solar cycle is the Sun currently? What year will the Sun be in solar maximum?
Sun cycle

The Worksheet for this portion of the lab may be separate.

In this section, you will be learning about the solar cycle. The solar cycle is a sinusoidal cycle that the sun goes through corresponding to its activity. The more active the sun is, the more sunspots it will have.

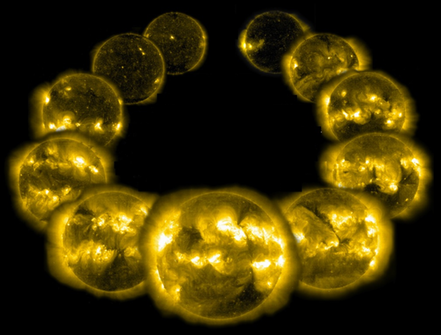
You are given 15 EIT continuum data images that represent a typical day between the years 1996 and 2006. The images are located in the shared drive ( Labimage -> Solar) on the desktop of the lab computers. Use the images of the Sun to answer the questions below. Note: There is one image per year.