Breadcrumb
- Home
- Labs
- Advanced Labs
- Astronomical Redshift
- Part 1: Measuring Rest Wavelengths
Part 1: Measuring Rest Wavelengths
The Balmer Series
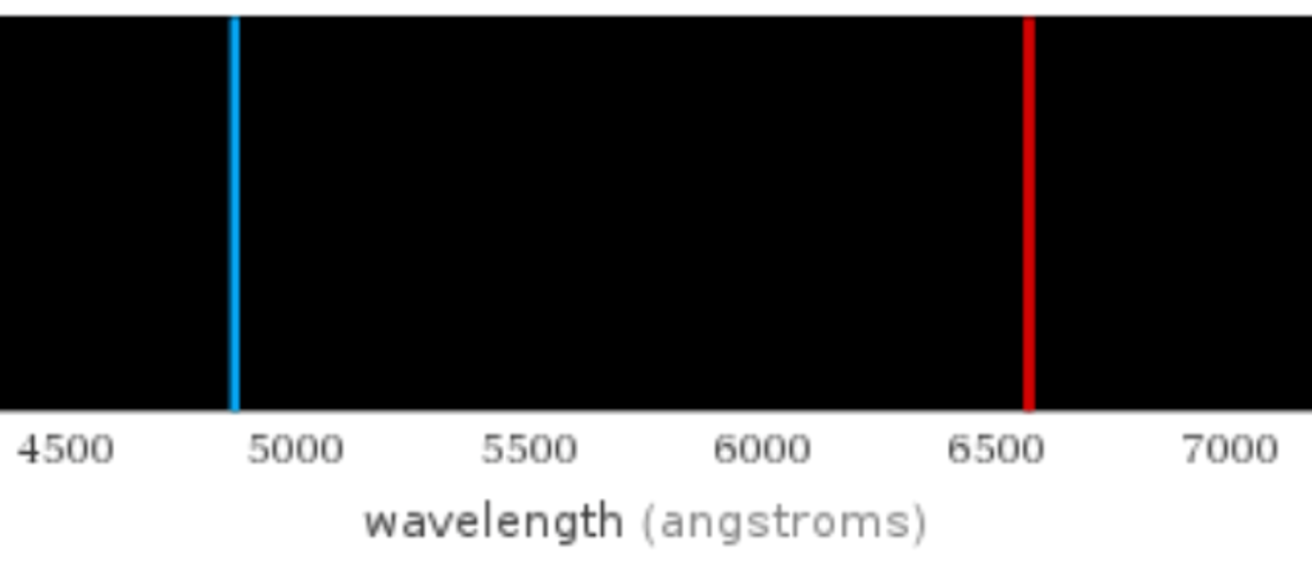
As you learned in the Spectroscopy lab, different elements emit and absorb specific wavelengths of light. One of the most commonly used spectral signatures in Astronomy is the spectral series of Hydrogen, whose emission and absorption lines are called the Balmer series (below). The lines are named, from longest to shortest wavelength, Hydrogen Alpha (red, at right below), hydrogen Beta (blue, at left below), hydrogen Gamma and hydrogen Delta (purple, at left below), and hydrogen Epsilon (not pictured) (or in simplified notation – Hα, Hβ, Hγ, Hδ, Hε); these lines will always be produced in this same order. Your group will use these features to measure the redshift of your quasar in Part 2.

Measuring Rest Wavelengths (not done for Spring 2021)
Open up the OceanView OceanOptics software or LoggerPro and observe the emission lines for Hydrogen in the sample from the carousel. Fill in the table with the peak wavelength, the name of the line in the Balmer series (i.e., Hα, Hβ, Hγ, Hδ, or Hε), and the relative strength of the line (estimating the percentage of its strength relative to the strongest line is a good way to go). Then, sketch the spectrum of Hydrogen and label the peaks with both the wavelengths and the names of the Balmer lines.