Exercise

In MaxIm DL, open the B and V images from M67. Open the FITS header window (crtl+f) to make sure you know which image is which. The B image was taken using Rigel telescope with the Blue Filter. The V image was taken with the Visual, or green, filter. 

In the lab packet, you will have , and  is the RA and Dec information for the stars. If you wanted to do a thorough analysis of the main sequence turn off age of M67, you would want to use every star that is associated with the globular cluster, but to streamline the process, the finder chart in the packet has marked a set of stars for today’s analysis.

The first step is to calibrate the images so you can record the apparent magnitudes (m) of the stars. You can only calibrate one image at a time, so choose one to start with.


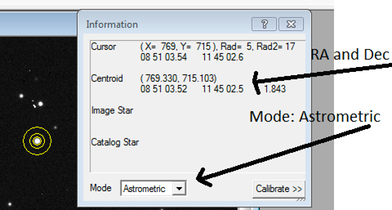
astrometric_med.png

Calibrating an Image

 When taking an image with a CCD camera, the CCD chip records the photons striking it, resulting in a number of digital counts (ADU). We need to tell MaxIm DL how to convert the ADU counts into magnitude units. To do this, we need a reference star with magnitudes in both the B and V bands. 

Find the reference star on your star chart. Using theAstrometric Mode option in the Information Window (crtl+i), you can check the RA and Dec of the star in the image. It should read 

RA(J2000) = 08:51:02.05 +11:45:19.13 .

The known apparent magnitudes of this star are 

B=15.72

V=14.982

and the Absolute magnitude is Mv = 5.01. It is an G7 V star.


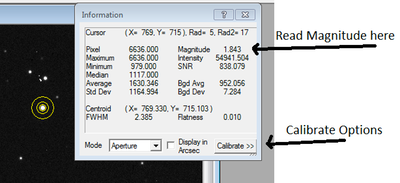
precali_med.png

In the Information Window, click on the Calibratebutton. This will allow us to tell MaxIm the magnitude of our reference star.

When the Information Window is open, the mouse cursor should look like a target, with three circles. By right clicking, you can change the size of these circles, which is important for accurately measuring the intensity of a star. There are three options

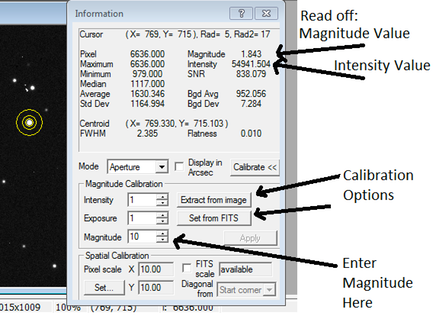
In the Information Window under the calibrate option, there are three Magnitude Calibration selections, Intensity, Exposure,and Magnitude. Enter the magnitude information for the reference star into the Magnitude box. Be sure you use the correct magnitude for the filter of the image you are using (e.g., B magnitude for the B image).


calibration_med.png

Then, click the “Set from FITS” button next to the Exposure box. This will set the exposure time correctly using the FITS header information.

Now, click on “Extract from Image” next to the Intensity box. Then, set the aperture to the correct size to calibrate the reference star and  double click on the reference star. This will freeze the aperture tool on the star and extract the intensity level from the image. Your image should now be calibrated.

Double check that when you hover over the reference star, it reads the correct magnitude in the Information Window. If it does not, try manually entering in the intensity.

Now that you have calibrated your image, you should not change any of the information in the Intensity, Exposure, or Magnitude box unless you are changing to a different image. You will need to recalibrate when you change to an image with a different filter.

You should read the magnitudes from the top of the Information window, not where you entered in the calibration.

Measuring Magnitudes

Using the finder chart, record the magnitudes for the stars for the B and V images. You will need both sets of numbers to find the temperature in the next part.

Guideposts

screenstretch_med(2).png

Adjusting the Image Contrast and Brightness

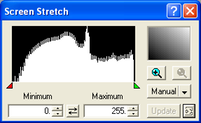
It is sometimes convenient to adjust the image display gray levels in order to enhance faint features in the image.  This is known as adjusting the histogram.  To do this, use the Screen Stretch window. If this window is not visible when Maxim starts, you can open it by selecting View -> Screen Stretch Tool from the menu.

The Screen Stretch window shows a histogram of the intensity levels in the image. The height of the histogram shows the number of pixels with a given intensity. The Minimum and Maximum boxes control the range of brightnesses which are actually displayed - the levels in the image are scaled as you change the range. The range can also be set with the red and green arrows.

stars
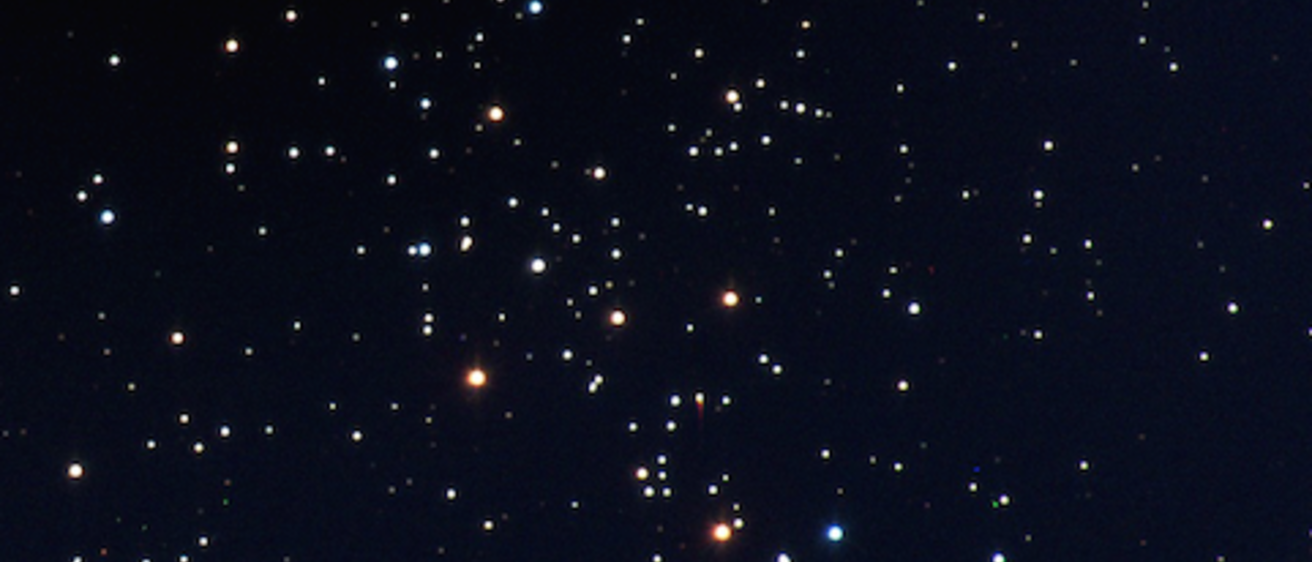
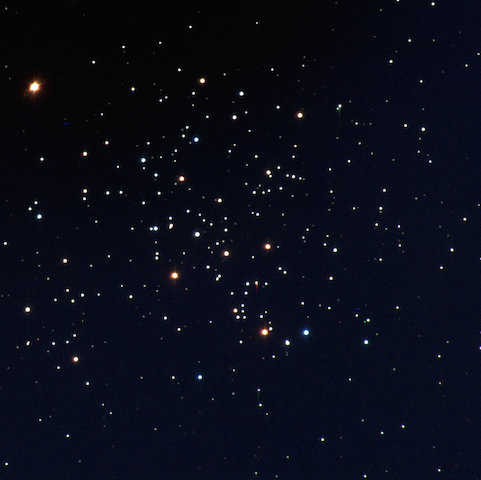
False Color Image of M67 taken with Rigel

Globular clusters are groups of stars that were formed at roughly the same time, which means that the stars are relatively the same age. You can think of them like a family of stars. Determining the age of a cluster is done by plotting the stars on the HR Diagram and looking for the main sequence turn off age. 

For this lab, you will be looking at images of M67, a globular cluster in the Milky Way. The image at the top of this page is a false color image of M67. You will need two images, one taken with a blue filter (B) and one with the green filter (V). They are located in the shared folders on the desktop (Labimages -> Cluster -> M67). You will be using photometry to find the temperatures and spectral types of the stars in M67.