Resources: Ocean Optics Spectrometer, Vernier Spectrum Tube Carousel, Optics Lab, Light Box

Terminology: SpectrumSpectral LinesEmission Lines

Tutorials: Using SpectraSuite Software

Background

Most of the objects we see in the everyday world are visible because they reflect ambient light into our eyes. These objects have color because they are made of materials that reflect certain wavelengths of light better than others. However, materials that are heated or otherwise injected with energy can also release this energy as light. The characteristics of this light can tell us the physical characteristics of the material.

Heating a dense gas or material will cause it to glow. This wavelength of this radiation is randomized by collisions in the material and ends up spread across a broad range of wavelengths, but peaks at a wavelength systematically related to the temperature. The relationship is given by Wien's Law.

wienslaw
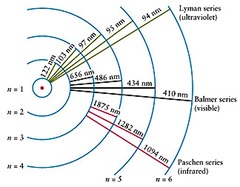
hydrogen transitions

Tenuous gases that are energized (e.g. by heating or electrical current) release that energy at discrete frequencies. This pattern of spectral lines is unique to each compound. This occurs because electrons in an atom are constrained to specific orbits, each of which has a particular energy. The energy of a photon depends on its frequency, and atoms can only absorb or release photons with energies with the right amount of energy to shift one of their electrons to another available energy level. The wavelengths of some of these photons for hydrogen are shown to the right.

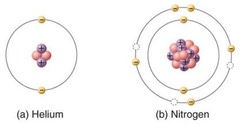
eshells he n

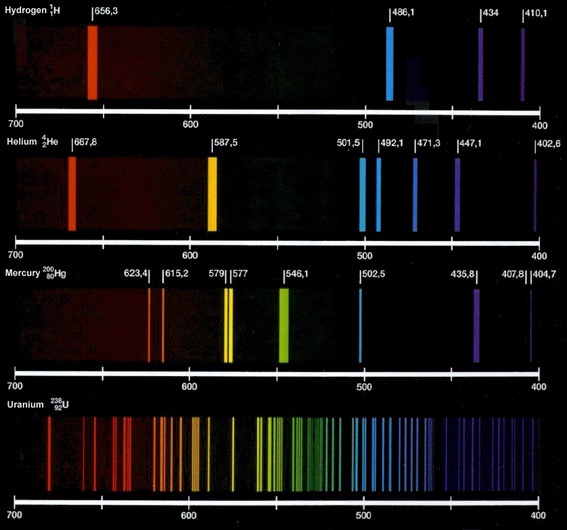
Atoms of different elements, such as helium and nitrogen shown schematically in the drawing to the right, have different allowable energy levels for their electrons. This produces different spectral lines for each atom. These spectral lines can appear as lines of color on a dark background, termed an emission spectrum. If a source of continuum radiation shines through the gas, such as a blackbody like the surface of a star, some of the radiation will be absorbed by the gas and scattered out of the line of sight. This produces a spectrum with dark spectral lines, or an absorption spectrum. Some sample spectra are shown below.

Guideposts

  • Some useful tips for using the SpectraSuite program to measure spectra can be found in the Tutorials section.
  • A little quick research on the internet can help you check some of your results in Parts 2 and 3.
spectra various
Spectrum of Hydrogen, Helium, Mercury, and Uranium
color spectrum

Learning Goals: The goal of this lab is to learn how a spectrum reveals the different frequencies present in a source of light, and how measuring the intensity of those frequencies can reveal things about the nature of the source. Students will learn the relationship between color and temperature and will see how the chemical composition of a source can be determined from its emission or absorption line spectrum.

Challenge: Understand the relationship between color and temperature for a light source. Identify a sample of hot gas by its pattern of emission lines.